»
S
I
D
E
B
A
R
«
Looking for the Orlando Magic’s Best Frontcourt Combination
Jan 19th, 2010 by Jon Nichols

My latest post at the Orlando Pinstriped Post is up:

http://www.orlandopinstripedpost.com/2010/1/19/1258396/looking-for-the-orlando-magics

Ryan Anderson vs. Brandon Bass: A Statistical Approach
Jan 12th, 2010 by Jon Nichols

My newest article at the Orlando Pinstriped Post takes a look at Ryan Anderson and Brandon Bass. You can find it here:

http://www.orlandopinstripedpost.com/2010/1/12/1246550/ryan-anderson-vs-brandon-bass-a

Tracking Dwight Howard’s Offense in the Magic’s 106-94 Victory Over the Timberwolves
Jan 4th, 2010 by Jon Nichols

My latest article at the Orlando Pinstriped Post (formerly Third Quarter Collapse) is up:

http://www.orlandopinstripedpost.com/2010/1/4/1233207/tracking-dwight-howards-offense-in

Tracking Defense in the Magic’s 104-99 Victory Over the Jazz
Dec 22nd, 2009 by Jon Nichols

The following is part of a weekly series at the Orlando Magic blog, Third Quarter Collapse.

Last week, I tracked the defense of the Magic.  Thanks to positive response from the readers, I have decided to do it again.  For a full a description of each statistic I track and what they mean, see last week’s article.  Basically, what I did was watch the game last night and keep my own statistics (things that are not in the box score).  Defensive statistics are often quite limited, and techniques such as manually charting and looking for certain things are often necessary to get a clearer picture.

Without further ado, here are the numbers from last night:

http://spreadsheets.google.com/ccc?key=0AvNKNGJ_AHijdHJqRkVlYmlhTTRETzRMZTV1OXh5Y0E&hl=en

Again, if you don’t know what any of those things mean, please read last week’s article.

  • This was a particularly difficult game to track.  Utah’s offense involves a lot of pick-and-rolls and other types of screens, so defending it is very much a team effort.  There were many plays where it was hard to give any individual credit or blame.  Perhaps in the future I will tinker with giving partial credit.
  • There were many occasions when a Magic defender could not keep up with his man through off-the-ball screens, and this is reflected in the statistics.  Vince Carter was the biggest culprit.
  • A player’s defensive statistics are highly influenced by his matchup.  That’s why bench players often look better than starters; they’re going against the other team’s reserves.
  • Because of his tough matchup (Deron Williams), Jason Williams allowed the most baskets on the team despite only playing 22 minutes.  D-Will was both faster and stronger than J-Will.  Considering J-Will’s poor defensive reputation, forcing four misses while only allowing five baskets isn’t terrible.  He did have some help though…
  • Dwight Howard was a beast as usual, both in one-on-one defense and help defense.  He forced 13 misses while being responsible for just four makes.  The rest of the Magic’s players give good effort on defense, but I’m pretty convinced Howard is reasons one through ten why the Magic are so good defensively every year.
  • It’s a shame MVP voting and overall popularity reflect offensive abilities more than anything, because after tracking Howard’s defense for two games, I don’t think it’s crazy to say he’s the best player in the league.  It’s just that most people’s definitions of “best” are different than mine.  LeBron James is a better offensive player, but Howard’s defensive impact is undeniable.
  • Don’t forget that Howard was often matched up against Carlos Boozer, an offensive stud.  Howard was able to hold Boozer under his season averages while also helping out all of his Magic teammates.
  • In his return, Jameer Nelson played solid D.
  • Anthony Johnson could not replicate the defensive performance he had against the Pacers and T.J. Ford.  Williams abused him a few times in the fourth quarter.
  • Rashard Lewis rebounded nicely from his poor defensive performance last time.  Some of you suggested that poor defensive job was an outlier, and you may be right.  It didn’t hurt that Mehmet Okur couldn’t buy a bucket, though.
Early Statistical Ratings for Magic Players
Dec 1st, 2009 by Jon Nichols

The following is part of a weekly series at the Orlando Magic blog, Third Quarter Collapse.

(Note: These stats are updated through November 27.  Games from this past weekend aren’t included. )

For those who are unaware, every year I calculate a statistic called Composite Score (numbers are here and here) for each player.  Composite Score is a rating system that combines six different advanced statistics, with three measuring offense and three measuring defense.  The offensive statistics are Offensive Rating, Offensive Plus-Minus, and PER.  The defensive statistics are Defensive Rating, Defensive Plus-Minus, and Counterpart PER (the estimated PER allowed on defense by a player).  These numbers can be obtained from Basketball-Reference.com and 82games.com.

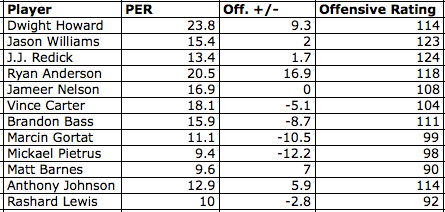
Although I can’t compute Composite Score for Magic players just yet (because of the way its calculated, I need the stats for every player in the league before I can calculate Composite Score), I can still present how every Magic player has fared in the individual components.  I will break things down into offense and defense.  Below is a table presenting every Magic player’s offensive performance so far, as measured by the three offensive statistics I mentioned earlier:
magicoffensivestats112709

Dwight Howard has been excellent as usual.  Jason Williams has been a pleasant surprise and has been particularly efficient, posting an Offensive Rating of 123.  His Offensive Rating is second on the team to J.J. Redick.  Believe it or not, the best newcomer offensively this year for the Magic has been Ryan Anderson.  Of course, don’t go crazy about his offensive plus-minus just yet.  That number can be flammable, and it is particularly unreliable this early in the year.  I included it for the sake of completeness, but I rarely use it for reference this early in the season.

By his standards, Vince Carter has struggled offensively.  His PER is still relatively good, but his Offensive Rating is below the league average.  Before his injury, Jameer Nelson was also failing to meet expectations, but again, he wasn’t bad either.  With the exception of Brandon Bass, many of the reserves have struggled somewhat on the offensive end, posting PER’s and Offensive Ratings below league average.  Following his return from suspension, Rashard Lewis has struggled perhaps as much as anyone else on the team.  His efficiency has been well below his usual rates.

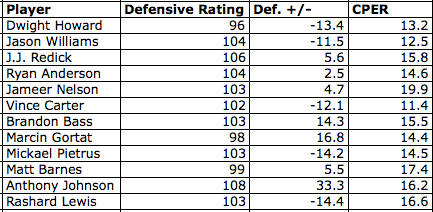
Next, let’s take a look at defense:
magicdefensivestats112709

Again, I wouldn’t draw too many conclusions from the plus-minus numbers.  As you can see from the table, if we were to take them at full value, we’d think the Magic is a team that is half defensive superstars and half defensive liabilities.

To start, Dwight Howard has been just as good on the defensive end as he’s been offensively.  A Counterpart PER of 13.2 for a center is particularly impressive.  Perhaps riding the coattails of players like Howard, Williams has posted good defensive numbers as well.  He’s never had the reputation of being a lockdown defender, but his effort has been solid.

Looking down the list of defensive stats, we see nothing out of the ordinary except for a few things.  Nelson’s CPER is very high, especially for a point guard.  Carter’s, on the other hand, is very low (more on this later).  Anthony Johnson’s plus-minus is comically bad, although that’s almost certainly the result of a small sample size.  Finally, Matt Barnes looks great defensively according to Defensive Rating, but below average according to CPER.  We’ll see how those numbers progress as the season goes on.

Back to Vince Carter’s defense.  A couple of weeks ago, I wrote an article comparing his defense to Hedo Turkoglu’s.  In the article, I said:

Here, Turkoglu strikes back.  Carter looks below average in just about every category, and this supports his reputation.  Turk, on the other hand, recorded numbers well above average in every category.  The trickiest part about these comparisons is team context.  It is something I’ve mentioned constantly when talking about my Composite Score numbers.  Because of the way stats are tracked (at least publicly), it’s very difficult to separate a player’s individual contribution to his defense.  How much of this is Hedo’s own doing, and how much of it is due to the fact that Orlando featured a very strong all-around defense?  It’s hard to say, but I do think Turkoglu was probably a better defender than Carter.

Looking at Carter’s numbers in the early going, we can see that the team you’re on sure has a huge impact on your defensive numbers.  He is better in every defensive category.  How does he compare to Turkoglu now?

cartervsturkogludefense112909

Turkoglu’s Defensive Rating has skyrocketed to 116, but his other defensive stats are still very impressive.  This year, it’s hard to tell which player is better on defense.  Carter has a low Defensive Rating and his plus-minus is very, very negative, but we don’t know how much that means yet.  I think the lesson to take from this is that defensive statistics are pretty unreliable, especially this early in the season.

We’ll have to return to these numbers in about a month or so.  The longer we wait, the clearer the picture becomes.

How is the Magic’s Defense Progressing
Nov 24th, 2009 by Jon Nichols

The following is part of a weekly series at the Orlando Magic blog, Third Quarter Collapse.

A couple of weeks ago, Eddy Rivera e-mailed me this:

“I was wondering if you could look at the progression of the Orlando Magic defense this year, in comparison to how the team progressed in its first month under Stan Van Gundy when he arrived in 2007. The reason why I ask is because that’s the first year the Magic were adjusting to SVG’s defensive scheme and eventually, they were ranked 6th in defensive efficiency. Given that this year is a new team of sorts, with so many new players, I wanted to see how the squad was adjusting on defense (SCHOENE projects them to finish 5th).”

It’s about time to take a look at this question.  With 14 games (through Sunday) now under their belts, the Magic have developed at least a tiny bit of a sample to look at their defense.

Eddy’s question seems pretty straightforward at first.  To find the answer, shouldn’t we just look at how many points the Magic are giving up each game this season?  Well, we already know that’s not going to work because you have to factor in pace.  Once you factor in pace, though, the study is still lacking.  After all, if the Magic play a bunch of offensively inept teams in games 1-7 and a lot of great offensive teams in games 8-14, it’s going to look like their defense is getting worse no matter what.  So we must also factor in the level of competition.

With that setup in mind, I took a look at the Magic’s defensive progression through 14 games for each of the last three seasons.  For each year, I calculated the points scored per 100 possessions of each opponent and compared that to their season average.  I called that difference (between the game total and the season average) “Defensive Score.”  I then plotted, for each season, the game number versus the Defensive Score for the first 14 games.  Let’s start by taking a look at 2007-08, Van Gundy’s first season with the Magic:

0708magicdefensefirst14

As you can see, the Magic were all over the place in their first 14 games, producing a wide range of Defensive Scores.  They allowed some teams to score nearly 30 points per 100 possessions above their season average (game #13 against San Antonio) but also held some teams to more than 30 below their season average (game #10 against New Jersey).  The fact that the two performances I just mentioned came in the same week shows how up and down the Magic were as they were adjusting to the defensive schemes of their new head coach.  I included a trend line in the chart, but don’t pay too much attention to it because we can see from the line’s information (on the right side) that it is a terribly poor fit.  In other words, there was no real progression (either good or bad) from the Magic in the first 14 games of 2007-08.

How about 2008-09?  Let’s take a look at the chart:

0809magicdefensefirst14

From the get-go, the Magic were dominating opponents on defense.  Most of the points on the chart are below 0, meaning the Magic were almost always holding their opponents to lower than their season average.  In addition, there weren’t any real stinkers.  Now in his second year at the helm, Van Gundy had his defense at midseason form early in 2008-09.

Finally, let’s look at this year’s Magic team, a squad that has certainly had its struggles on defense:

0910magicdefensefirst14

True to form, the Magic were quite poor in their first seven games this year (with decent performances in the middle).  However, things started to change in games 8-9, when the Magic at least held their opponents to close to their season averages.  Lately, though, they’ve been playing great defense.  In four of their last five games, Orlando has held their opponent below their season average.  The one slipup was November 16, when the normally putrid Bobcats were able to put up a few points in Orlando. Overall, though, there appears to be a clear progression and a sign that the Magic’s defense is getting better.  Unlike the last two trend lines, which had very poor line statistics, this line appears to be a pretty good fit.  If you want the details as to why and are unfamiliar with R^2, click on this link, read about it, and check back here.  Basically, there does appear to be something positive going on with the Magic defense.

I think these graphs are pretty enlightening.  They show that this year’s Magic defense just needs time to get to its 2008-09 levels.  I will check back in with these numbers in the future.

»  Substance: WordPress   »  Style: Ahren Ahimsa
© Copyright 2009 Basketball-Statistics.com