Introduction
One thing many people have wondered is whether or not there are diminishing returns for rebounds. Basically, what that would mean is that not all of a player’s rebounds would otherwise have been taken by the opponent; some would have been collected by teammates. Therefore, starting five lead leaguers in rebounds would probably be overkill because eventually they’d just steal them from each other. At some point, there are only so many rebounds a team can grab, and some are just bound to end up in the hands of the opponent.
This principle is very important to statisticians who wish to develop player ratings systems. These ratings often assign weights to different statistics (including offensive and defensive rebounds), so knowing that a defensive rebound collected by one player would most likely otherwise have been collected by a teammate makes that stat less “valuable” in terms of producing wins.
Methodology
To test the effect of diminishing returns of rebounds, I decided to go through the play-by-play data (available at Basketball Geek) and compare each lineup’s projected rebounding rates (the sum of each player’s individual rebound rates for the season) to their actual rebounding rates (what percentage of rebounds that lineup grabbed while it was on the floor). After doing some research, I found out a very similar study was done by Eli Witus (formerly of CountTheBasket.com, currently of the Houston Rockets). Before you proceed with the rest of my article, you should read his. Although my method is slightly different, he provides a great explanation of why it’s useful to do the research this way and he also lists some advantages and disadvantages of this method.
Before I show you the results, I should explain the intricacies of my research and also some of the differences between Eli’s study and mine. The individual rebound rates I used were taken from the rebound rates I calculated myself using the play-by-play data. Because both the individual rates and the lineup rates were calculated from the same data, there’s less risk of error due to silly things such as differences in calculations or incomplete data. Also, to reduce the effects of small sample sizes due to lineups that didn’t receive a lot of minutes together, Eli chose to group lineups into bins based on their projected rebound rates. He then regressed each bin ‘s (a collection of different lineups with similar projected rebound rates) projected rebound rate to its actual rebound rate.
When I was coming up with my idea, I chose to do things a little differently, although the purpose is the same. Instead of grouping the lineups into bins, I simply only selected the lineups that met a minimum qualification for plays. Only lineups that appeared in at least 400 plays were included in my study. This left me with a sample size of 475 lineups. Like Eli, I then regressed the projected rebounding rates versus the actual rebounding rates. One final difference between us two is that his article was written in February of 2008, so I’m presuming he used data from the 2007-08 season. I’m using data from the 2008-09 season.
Offensive Rebound Rate
The graph for Offensive Rebound Rate is below:
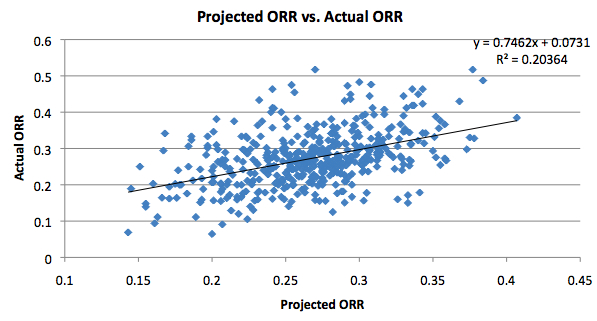
The key to understanding this graph is looking at the slope of the line. Here, it is 0.7462 (close to the 0.77 number he got). If there were no diminishing returns for offensive rebounds, the slope would be 1. This would mean that for each additional rebound a player could offer to his lineup, he would actually add one rebound to the lineup’s total. If the slope is less than one (such as in this case), it means that each additional offensive rebound by the player adds about 0.75 to the lineup’s total, because some of those would have been taken by his teammates anyways. The slope I have here is pretty high, though, indicating that the diminishing returns effect for offensive rebounds isn’t too strong.
Defensive Rebound Rate
In his study, Eli found that the diminishing returns effect was much stronger for defensive rebounds. Can I replicate his results? Below is the graph for defensive rebounds:
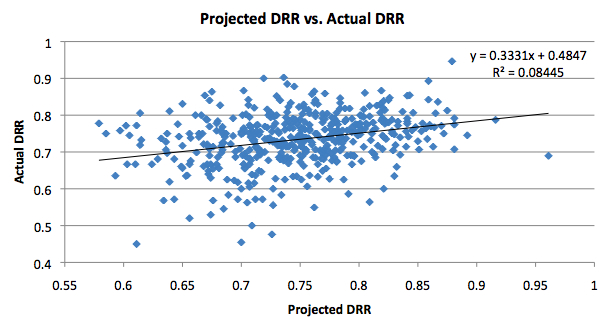
Eli found a slope of 0.29. Mine was close, but slightly higher at 0.3331. Regardless of the minor difference, we both can come to the same conclusion: there is a much stronger diminishing returns effect at play with defensive rebounds than there is with offensive rebounds. While each offensive rebound adds 0.75 to the lineup’s total, each defensive rebound only adds 0.33, indicating that many defensive rebounds are taken away from teammates. Of course, individual cases can vary.
These results help explain why a lot of player rating systems make defensive rebounds “worth” less than offensive rebounds. Eli has a good explanation of it at the end of the article here. For example, in his PER system, John Hollinger assigns offensive rebounds a value more than double the value of defensive rebounds. This is partly due to the diminishing returns effect we found here today and originally in Eli’s work. As it turns out, my numbers indicate that offensive rebounds are in fact worth a little more than double the value of defensive boards. So hats off to Hollinger and his many contemporaries who have managed to weight rebounds appropriately.
Further Exploration
I could stop here, but I’d like to take this research a little further and see what other insights we can come up with. First, I’d like to break down the data by location (home and away).
Home Data
One thing to note is that the projected rebounding rates for the lineups are based on overall individual ratings, not just for home games. If rebounding was usually in favor of the home teams, this would lead the projected lineup rebounding rates to usually underestimate the actual rates in this case. However, since it would presumably do this for all lineups, we can still take a look at the effect of diminishing returns.
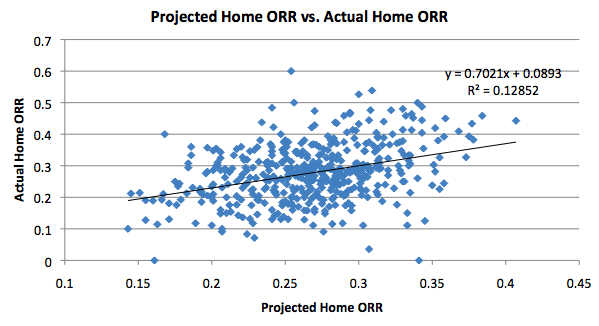
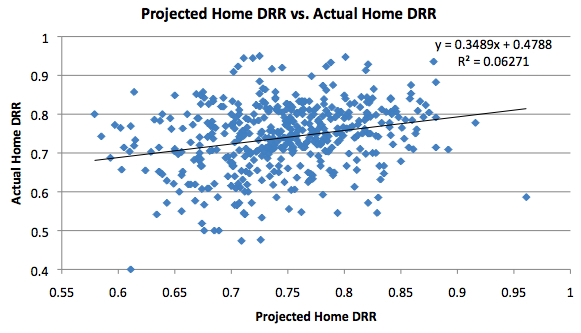
With that being said, how does the home data compare to the overall data? For offensive rebounds, the slope is flatter, indicating a stronger effect of diminishing returns. However, for defensive rebounds, the slope is slightly higher, indicating a lesser effect. The differences are minor, though.
Away Data
We can also take a look at the away data:
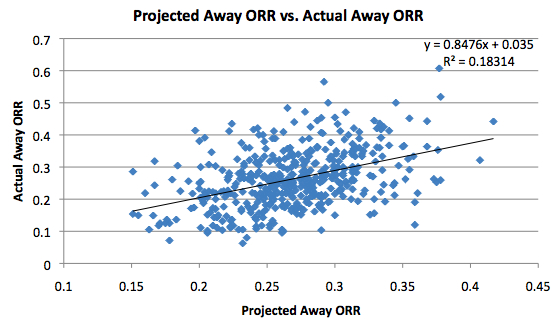
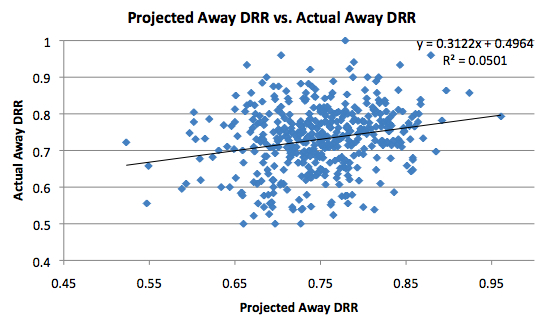
As you would expect given what we now know about the home data, the effect of diminishing returns appears to be much weaker on the road for offensive rebounds. In fact, as we can see, the slope is getting close to 1. This indicates that there isn’t much in terms of diminishing returns for this type of rebound. Intuitively, this makes sense. If teams rebound the ball better at home, there are less offensive rebound opportunities for the visiting team. Therefore, it is more likely that an offensive rebound by a visiting player would otherwise have been grabbed by the opponent as opposed to one of his teammates, which in turn makes good offensive rebounders more valuable on the road. The same pattern doesn’t follow for defensive rebounds, though. In both cases, the difference isn’t gigantic, so we should be hesitant to draw any serious conclusions.
The one difference that is large and consistent is the difference in slopes between offensive and defensive rebounds, no matter the location. Confirming what Eli found in his original studies, this data says that the effect of diminishing returns is much stronger on defensive rebounds than it is on offensive ones. Therefore, offensive rebounding is a more “valuable” skill in terms of how you rate players, and some of the best player rating systems do take this into consideration.
Other Statistics
So far, this whole article has been about the diminishing returns of rebounds. However, we can also use the same lineup-based approach to look at other statistics. Today I’ll also explore the diminishing returns of blocks, steals, and assists. Eli already used his method to take a crack at the usage vs. efficiency debate, and I recommend you read that article for some fascinating insight.
Block Rate
Block Rate, for a lineup, is defined as the percentage of shots by the opposing team that is blocked by one of the players in the lineup.
Blocks are an interesting statistic to examine. After all, there are only so many block opportunities around the basket and occasionally on the perimeter. When you also take into consideration the fact that teams often funnel players into the waiting arms of a dominant shot-blocker, it seems as though the diminishing return for blocks should be relatively strong. That is, if you add a shot blocker that normally blocks 4% of the opposing team’s shots to your lineup, you shouldn’t expect to block nearly that many more as a team because of diminishing returns. To see if this is true, I used the same methodology that I did for rebounding and came up with this graph:
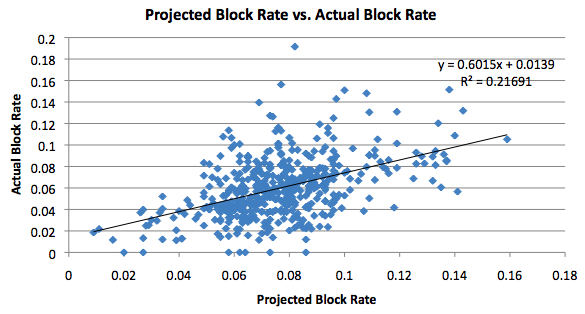
As it turns out, the slope is at 0.6015. This puts Block Rate somewhere in the middle between Offensive Rebounds and Defensive Rebounds. A lineup full of good shot blockers will almost certainly block more shots than a weaker lineup, but the difference may not be as much as you might think due to effects of diminishing returns.
Steal Rate
Up next we have Steal Rate. For an individual, it is defined as the number of opponent possessions that end with the given player stealing the ball. Therefore, for a lineup, it would be defined as the number of opponent possessions that end with a steal by anyone from that lineup. The graph for Steal Rate is below:
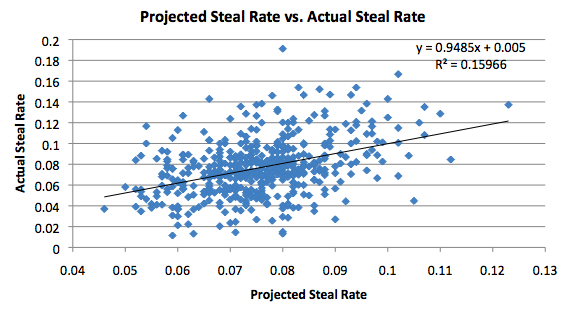
Here, we see the slope is nearly 1. This indicates that there is practically no diminishing returns effect on steals. If you add a player 2% better than average in terms of steals to your average lineup, you should expect to steal the ball almost 2% more than you currently do. Another way to put it is that usually, if a given player steals the ball, it’s not likely that someone else would have stolen the ball if he failed. Of course, like with every graph so far, the R^2 is still very low. This means that we can’t really predict how many steals a lineup will get simply by adding the Steal Rates of all of its players.
Assist Rate
Finally, we have Assist Rate. For an individual, it would mean the number of field goals made by a player’s teammates that he assisted on. For a lineup, it means the percentage of made field goals that were set up by an assist. The graph is below:
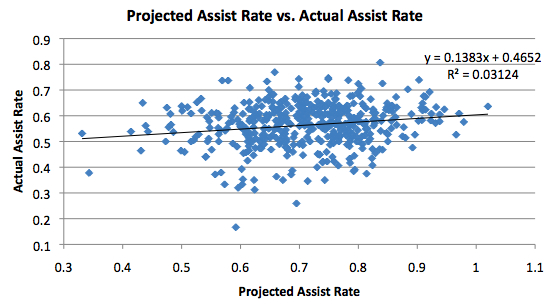
Of any graph presented on this page so far, this one has by far the lowest slope. Normally this would indicate that there is a huge diminishing returns effect for assists. However, I’m not sold on this explanation just yet for various reasons, so for now I will just present the data as is.
Conclusion
I discussed a number of different issues today, so I think it’s good to recap what I’ve presented. First, using a method similar to the one Eli Witus used at CountTheBasket.com, I found that there is a large diminishing returns effect for defensive rebounds that is significantly larger than the effect for offensive rebounds. This confirms the common belief that offensive rebounds are “worth” more than defensive ones. When we split the data into home and away, it appears that individual offensive rebounding skill is particularly important on the road, indicated by a very high slope on the graph. Finally, I took a look at the diminishing returns of a few other advanced statistics and found the strongest effect on assists and a weaker but still significant effect on blocks.
If you have suggestions or comments about my work, please e-mail me at [email protected]. And again, much credit must go to Eli Witus, who originally thought of these ideas well before I did.