The following is part of a weekly series at the Orlando Magic blog, Third Quarter Collapse.
A couple of weeks ago, Eddy Rivera e-mailed me this:
“I was wondering if you could look at the progression of the Orlando Magic defense this year, in comparison to how the team progressed in its first month under Stan Van Gundy when he arrived in 2007. The reason why I ask is because that’s the first year the Magic were adjusting to SVG’s defensive scheme and eventually, they were ranked 6th in defensive efficiency. Given that this year is a new team of sorts, with so many new players, I wanted to see how the squad was adjusting on defense (SCHOENE projects them to finish 5th).”
It’s about time to take a look at this question. With 14 games (through Sunday) now under their belts, the Magic have developed at least a tiny bit of a sample to look at their defense.
Eddy’s question seems pretty straightforward at first. To find the answer, shouldn’t we just look at how many points the Magic are giving up each game this season? Well, we already know that’s not going to work because you have to factor in pace. Once you factor in pace, though, the study is still lacking. After all, if the Magic play a bunch of offensively inept teams in games 1-7 and a lot of great offensive teams in games 8-14, it’s going to look like their defense is getting worse no matter what. So we must also factor in the level of competition.
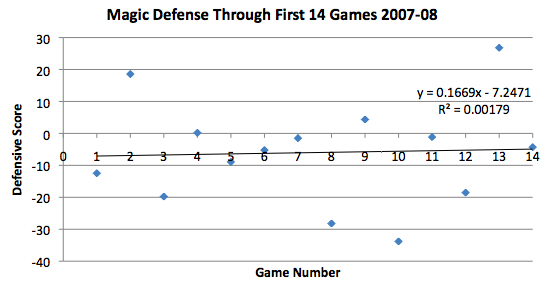
With that setup in mind, I took a look at the Magic’s defensive progression through 14 games for each of the last three seasons. For each year, I calculated the points scored per 100 possessions of each opponent and compared that to their season average. I called that difference (between the game total and the season average) “Defensive Score.” I then plotted, for each season, the game number versus the Defensive Score for the first 14 games. Let’s start by taking a look at 2007-08, Van Gundy’s first season with the Magic:

As you can see, the Magic were all over the place in their first 14 games, producing a wide range of Defensive Scores. They allowed some teams to score nearly 30 points per 100 possessions above their season average (game #13 against San Antonio) but also held some teams to more than 30 below their season average (game #10 against New Jersey). The fact that the two performances I just mentioned came in the same week shows how up and down the Magic were as they were adjusting to the defensive schemes of their new head coach. I included a trend line in the chart, but don’t pay too much attention to it because we can see from the line’s information (on the right side) that it is a terribly poor fit. In other words, there was no real progression (either good or bad) from the Magic in the first 14 games of 2007-08.
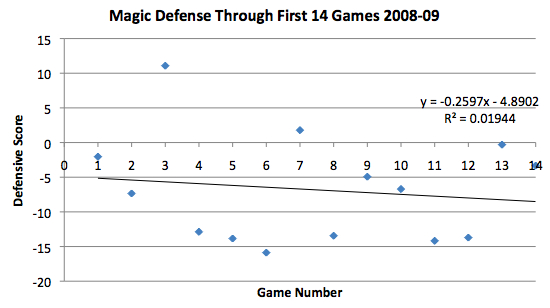
How about 2008-09? Let’s take a look at the chart:

From the get-go, the Magic were dominating opponents on defense. Most of the points on the chart are below 0, meaning the Magic were almost always holding their opponents to lower than their season average. In addition, there weren’t any real stinkers. Now in his second year at the helm, Van Gundy had his defense at midseason form early in 2008-09.
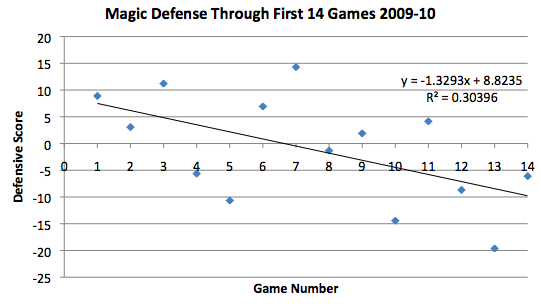
Finally, let’s look at this year’s Magic team, a squad that has certainly had its struggles on defense:

True to form, the Magic were quite poor in their first seven games this year (with decent performances in the middle). However, things started to change in games 8-9, when the Magic at least held their opponents to close to their season averages. Lately, though, they’ve been playing great defense. In four of their last five games, Orlando has held their opponent below their season average. The one slipup was November 16, when the normally putrid Bobcats were able to put up a few points in Orlando. Overall, though, there appears to be a clear progression and a sign that the Magic’s defense is getting better. Unlike the last two trend lines, which had very poor line statistics, this line appears to be a pretty good fit. If you want the details as to why and are unfamiliar with R^2, click on this link, read about it, and check back here. Basically, there does appear to be something positive going on with the Magic defense.
I think these graphs are pretty enlightening. They show that this year’s Magic defense just needs time to get to its 2008-09 levels. I will check back in with these numbers in the future.