Recently I took a look at the diminishing returns of rebounds, assists, steals, and blocks. As you may or may not have noticed, one common type of statistic was missing: shooting. Today I’m going to fill in the blanks using the same approach as last time.
If you haven’t read the previous article, the premise is simple. For each lineup in the NBA last year that appeared in at least 400 plays, I project how they will do in each stat using the sum of their individual stats. For example, to predict a lineup’s offensive rebound rate, I simply add the offensive rebound rates of each of the five players in the lineup. I then compare this projection to the actual offensive rebounding rate of the lineup. These steps are followed for each lineup and for each statistic.
If there are diminishing returns (i.e. in a lineup of five good rebounders, each player ends up stealing a little bit from his teammates), the correlation between the projected rates and the actual rates will be significantly lower than one. In other words, for each percentage of rebounding rate a player has individually, he will only add a fraction of that to the lineup’s total because some of his rebounds will be taken away from teammates.
If this still isn’t clear to you, be sure to check out the old article. Once you’ve done that, this article will make more sense.
Back to shooting. I’ve decided to take a look at the diminishing returns of eight aspects of shot selection/efficiency: three-point shooting percentage, three-point attempt percentage (the percentage of a player’s total attempts that are threes), close (dunks/layups) shooting percentage, close attempt percentage, midrange shooting percentage, midrange attempt percentage, free throw shooting percentage, and free throw attempt percentage.
To project a lineup’s percentage in one of those categories, I can’t simply add up the five individual percentages. For example, a lineup of five 30% three-point shooters is not going to shoot 150% from beyond the arc. Instead, I have to calculate a weighted average for the lineup. Therefore, each player’s three-point shooting percentage is weighted by the amount of threes he took. The same approach can be taken with attempt percentages.
For some statistics, such as free throw percentage, we shouldn’t expect to see any diminishing returns. After all, adding a great free throw shooter to a lineup shouldn’t make the other players in the lineup shoot worse from the foul line. However, with other stats (especially attempt percentages), diminishing returns seem more possible.
To start, let’s take a look at the diminishing returns of three-point shooting percentage:
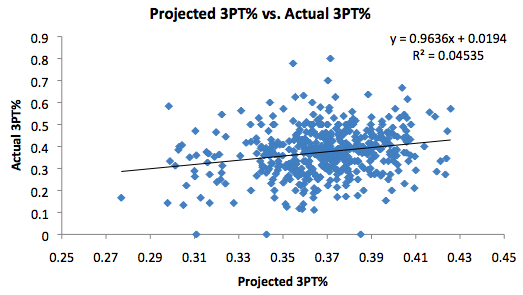
Here we see the slope is just about 1. However, the standard error for this slope is 0.21, so the results are pretty inconclusive.
How about three-point attempt percentage?
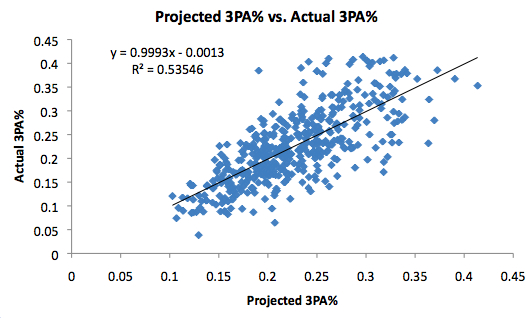
Again the slope is just about 1. This time, though, the standard error is just .04. Therefore, we can say with pretty good certainty that there are no diminishing returns for three-point attempt percentage. In other words, adding a player to your lineup that likes to shoot threes is going to add a proportional amount of three-point attempts to your lineup total.
Up next we have close shooting percentage:
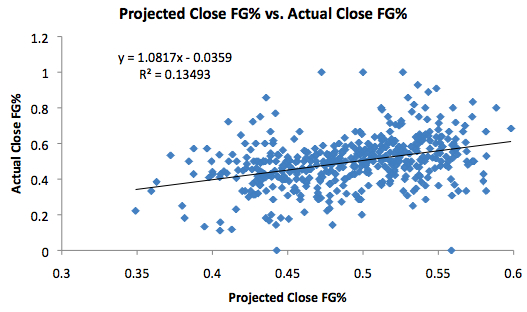
The slope is actually above 1 this time, although it’s less than one standard error away from 1. There definitely is no clear evidence of diminishing returns for close shooting percentage. Adding an efficient player around the basket to your lineup will probably not make your other players less efficient around the basket.
Close attempt percentage:
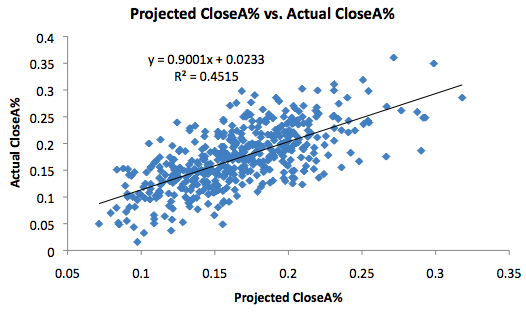
The standard error for this slope is just .05, so we may be seeing slight diminishing returns. But not much.
Midrange shooting percentage:
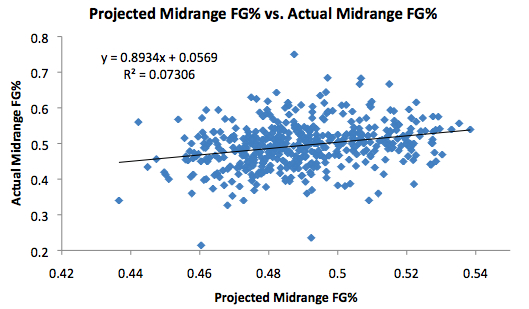
The standard error for this one is pretty large (0.15), but again there are no real signs of diminishing returns.
Midrange attempt percentage:
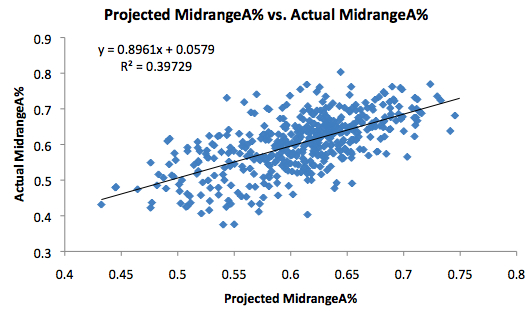
These results are pretty similar to those of close attempt percentage. The slope is less than 1 and the standard error is pretty small. Again, though, the diminishing returns effect appears to be quite small.
Free throw percentage:
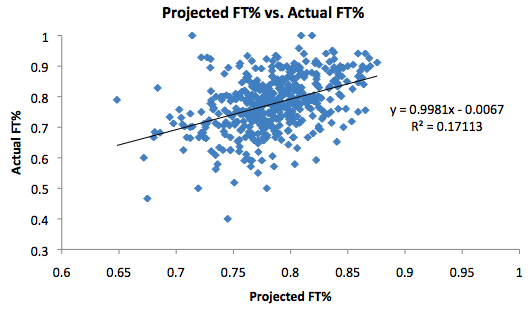
As I mentioned in the beginning of the article, we shouldn’t expect to see diminishing returns on free throw percentage, and we don’t.
Free throw attempt percentage:
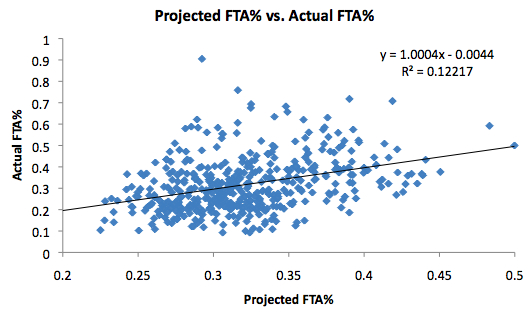
Just like the rest of the stats we looked at, we don’t really see a hint of diminishing returns for free throw attempt percentage.
Conclusion
Unlike statistics such as rebounds, assists, steals, and blocks, shooting (in all of its forms) doesn’t seem to have the problem of diminishing returns. A player’s shooting efficiency will have a proportional impact on a lineup’s shooting efficiency, and his shooting tendencies will have a proportional impact on a lineup’s shooting tendencies. There are other ways to attack this question, though, and in the future I plan on doing just that.