»
S
I
D
E
B
A
R
«
How Accurate are some of the Advanced Stats That We Use?
Nov 18th, 2009 by Jon Nichols

Last week, I calculated my own version of various advanced statistics, such as Rebound Rate, Assist Rate, and Usage Rate.  The difference between my versions and the ones you normally see are that mine were based on actual play-by-play data, rather than estimates.  Although my method isn’t perfect (partly because the play-by-play isn’t always reliable), I figured it was more accurate to base our stats on stuff that has actually happened as opposed to estimates of what happened.

Under that assumption, the question is how accurate are the numbers we’ve grown to know and love?  Although they’re not too difficult to calculate, the play-by-play figures aren’t always available, so we need to know if we can count on the data that is most common.  How far off are these estimations?  Are there certain types of players for which these stats are usually inaccurate?

To recap, these are the stats in question:

  • Rebound Rate
  • Offensive Rebound Rate
  • Defensive Rebound Rate
  • Assist Rate
  • Steal Rate
  • Block Rate
  • Usage Rate

Let’s start with a simple test.  How well do the estimated numbers correlate with the play-by-play numbers?  Below is a table that includes the R^2 (explanation) and standard error of each linear regression, as well as the average difference between the two types:

percorrelations

Thankfully, we see that all of the estimations appear to be pretty darn accurate.  The R^2’s are all extremely high, and the standard errors are low.  Of the seven stats I’m examining, Steal Rate appears to be the most inaccurate.  It fares the worst in each of the three table columns.  Overall Rebound Rate appears to be the most accurate.  From this table, we are given no reason to doubt the validity of the box score estimations.

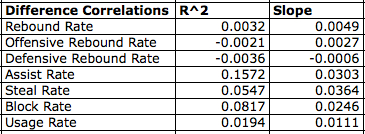
Although they may be accurate as a whole, perhaps these numbers are inaccurate just for certain players.  Specifically, I was wondering if players that rate either really high or really low in a certain statistic are generally rated accurately by the box score estimation.  To try to answer that question, I ran another regression.  This time, the box score estimation was the independent variable, and the difference between the box score and play-by-play was the dependent variable.  The results are in the table below:
perdifferencecorrelations

There are some things to look out for.  Although the adjusted R^2’s are all quite low, even negative sometimes, the slopes are all positive.  This would indicate that as a given player gets better in a certain statistic, the box score data is more likely to overrate him in that category.  The biggest problems occur with Assist Rate, which has a moderately sized R^2 value.

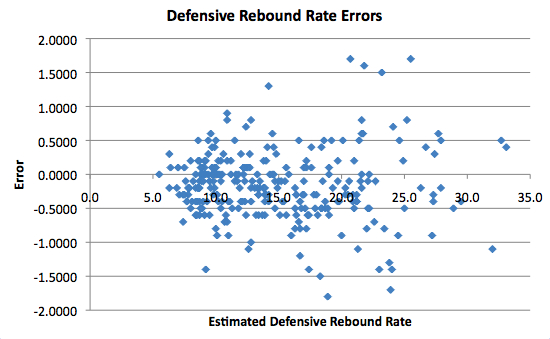
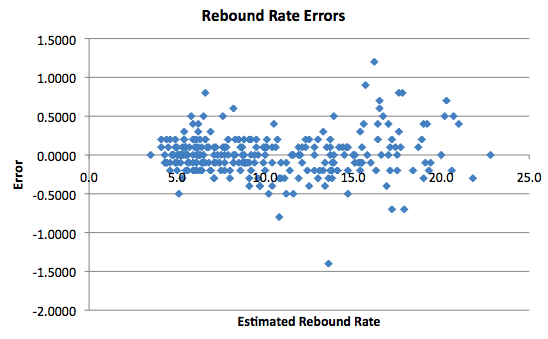
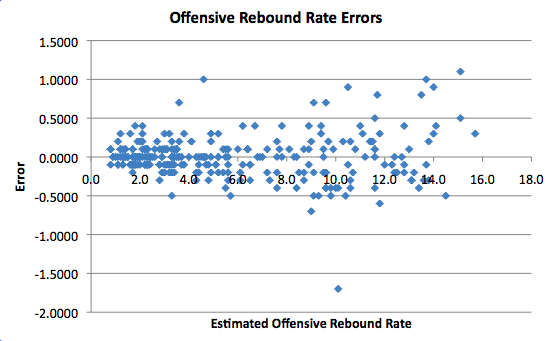
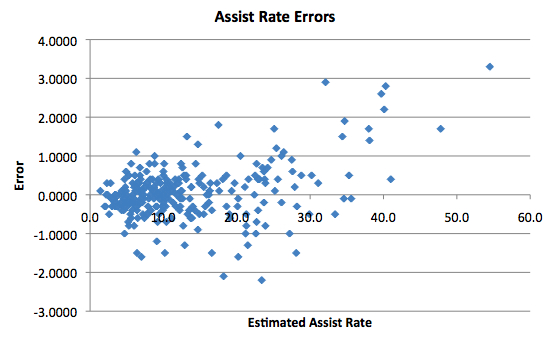
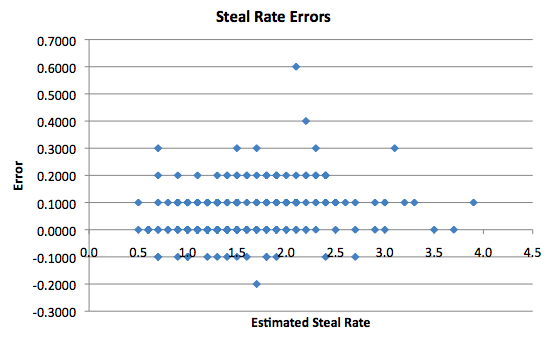
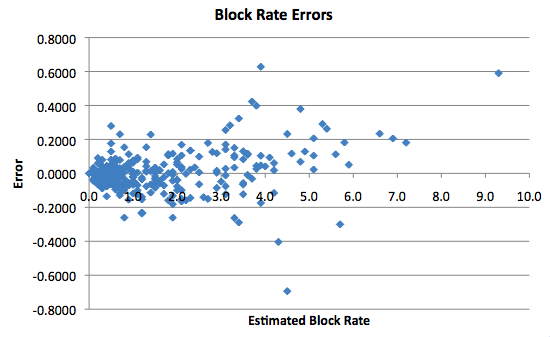
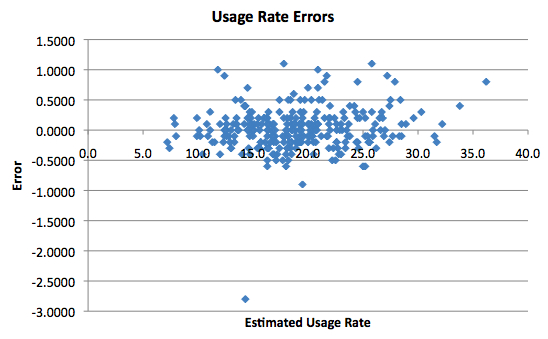
If that table doesn’t seem intuitive, I’ve also decided to present the results graphically.  In each chart below, the x-axis is the box score estimate’s value, and the y-axis is the difference between the estimate and the play-by-play calculation.
reboundrateerrors

offensivereboundrateerrors

defensivereboundrateerrors

All three Rebound Rates look pretty accurate, although they become more unpredictable as the numbers get high, especially with respect to Defensive Rebound Rate.  When the Rate is around 10, the errors are pretty closely scattered around 0.   However, when you get to 17.5 or 20, the errors become larger.
assistrateerrors

As I mentioned before, Assist Rate seems to have some major issues.  For low Assist Rates, the differences are pretty small.  However, when you get to the top assist men, the differences can be quite large.  For example, Chris Paul’s Assist Rate for last season, according to the box score data, was 54.5.  However, the play-by-play data has it at 51.2.  For someone like him, where the number is astronomically high no matter which method you choose, the difference might seem trivial.  But it does appear that top assist men are overrated the most by Assist Rate.
stealrateerrors

There’s not much to gather from the Steal Rate chart, although it becomes clear that my play-by-play computations are generally lower than the box score estimates.
blockrateerrors

Like Rebound Rate, Block Rate becomes particularly difficult to estimate when the numbers get high.  As a percentage of the Block Rate, though, the difference is actually pretty consistent.
usagerateerrors

Finally, we have Usage Rate.  There aren’t any major issues except for one outlier at the bottom, which is the result of complications due to the weirdness of Luc Richard Mbah a Moute’s name (seriously).

In conclusion, my research has shown me that, despite some minor issues, the box score estimations of things such as available rebounds are actually pretty close.  They aren’t always perfect, and they can be particularly unreliable when the numbers get large, but overall they do a good job.  Hopefully this work will provoke discussion on how we can continue to perfect those stats.

2008-09 Recalculated Stats Version 3.0
Nov 18th, 2009 by Jon Nichols

Another quick update. I removed the 0.44 estimator I was using for Steal Rate and Usage Rate to calculate possessions. Instead, I totaled the possessions from the play-by-play data itself. The updated numbers are below.

http://spreadsheets.google.com/ccc?key=0AvNKNGJ_AHijdEVHZXpaeGl5Q1ZVZVF0WVd3Ri1IR1E&hl=en

Replacing Estimates of Magic 08-09 Stats With Real Ones
Nov 17th, 2009 by Jon Nichols

The following is part of a weekly series at the Orlando Magic blog, Third Quarter Collapse.

Some of the best stats out there, ones that most fans familiar with advanced stats know about, are actually based on estimates using box score data.  For example, when we calculate Marcin Gortat’s Offensive Rebound Rate, we’re trying to determine what percentage of available offensive rebounds he collected while he was on the court.  However, we don’t really know how many rebounds were available.  We have to estimate based on how things usually go for the Magic and their opponents, and assign a portion of that to Gortat.

Using box score data, that’s the best we can do.  But we also have play-by-play data, and we don’t have to estimate.  We (actually, a programming script) can go through the hundreds of thousands of recorded plays from the NBA 08-09 season, and find how many of those resulted in offensive rebound opportunities for Gortat.  From there we just total how many offensive boards he had, and divide that by the number of available ones.

This method removes some of the guessing game, and the results of this method on various stats for the Magic will be discussed today.  For a full explanation of how everything works, I will refer you to the article I wrote over at Basketball-Statistics.com last Thursday, which is here.  Let’s start by comparing the estimated rebound rates to the actual ones, as calculated from the play-by-play data:

comparingmagicrebounds

We can see that the estimates are pretty darn close.  Amazingly, though, Dwight Howard is an even better rebounder than we thought (by 0.3%).  Gortat’s offensive rebounding may have been slightly overestimated, but his defensive rebounding was underestimated.  The biggest differences were for Keith Bogans and Rafer Alston, who were actually not rebounding as well as we thought.

Now let’s move on to some stuff for the little guys.  Here are the comparisons for assists and steals:

comparingmagicassistsandsteals

Jameer Nelson’s Assist Rate may have been inflated, while Anthony Johnson didn’t receive enough credit.  When we use the play-by-play data instead of the estimates, the difference between the two shrinks from 10.9% to 7%.  My play-by-play steal rates are slightly lower for every player, and that may have something to do with differences in the way I calculated possessions.

Finally, let’s look at blocks and usage rate:

comparingmagicblocksandusage

Again, we see that each player’s PBP data is less than his estimated data.  This is not a Magic-only thing.  The reason for this difference is again due to different calculations.  Block percentage is normally calculated as the percentage of opponents’ two-point attempts that were blocked by the player in question.  My calculations counted three-point attempts as well.  I feel that this way is more appropriate because, even though it’s rare, three-pointers do get blocked.  With usage rates, we again see that the estimates were actually pretty close to the real thing.

Because the differences between the estimates and the play-by-play data are usually small, this information may seem trivial.  In many ways, it is.  However, it’s nice to get that warm fuzzy feeling when you know the numbers you’re looking at are thoroughly calculated instead of just estimations.

What, does nobody else get that feeling?

Updated Recalculated 2008-09 Stats
Nov 16th, 2009 by Jon Nichols

When I posted my recalculated stats using play-by-play data over at the APBRmetrics board, I learned that the Block Rates at Basketball-Reference are actually calculated using only opposing two-point attempts.  In other words, a player’s Block Rate is the percentage of opposing two-point field goals that the player blocked.

With that new piece of information, I recalculated the Block Rate for every player.  The new figures, along with the rest of the recalculated stats, are posted below:

http://spreadsheets.google.com/ccc?key=0AvNKNGJ_AHijdFBvcGZLTmxBTzhzM19yTjhzUzRZYUE&hl=en

Recalculating Advanced Stats Using Play-by-Play Data
Nov 12th, 2009 by Jon Nichols

Recently at his web site, Basketball Geek, Ryan Parker used play-by-play data to calculate Dean Oliver’s offensive and defensive ratings.  I’ve decided to use Ryan’s approach (and data!) to calculate some of the other advanced statistics out there, many of which were developed by John Hollinger.

Many of these statistics are usually calculated using estimates based on the data available in box scores.  However, with the play-by-play data in hand, we can turn these estimates into actual numbers.  To calculate the stats, I used the formulas available in the Basketball-Reference glossary.  For today, the following numbers will be presented:

  • Rebound Rate: The number of available rebounds a player collected while he was in the game.
  • Offensive Rebound Rate: The number of available offensive rebounds a player collected while he was in the game.
  • Defensive Rebound Rate: The number of available defensive rebounds a player collected while he was in the game.
  • Assist Rate: There are a few ways to calculate this.  I defined it as the percentage of field goals a player’s teammates made that he assisted on while he was in the game.
  • Block Percentage: The percentage of opponent field goal attempts blocked by a player while he was in the game.
  • Steal Percentage: The number of opponent possessions that ended with the player stealing the ball while he was in the game.
  • Usage Rate: The percentage of team plays used by a player while he was in the game.

There are a number of different ways to calculate Assist Rate.  I calculated my version based on the method used by people such as Ken Pomeroy and Ed Kupfer.  Ryan defines his Assist Rate as the “percentage of possessions used that were assists.”  There are subtle differences, I believe.

So what’s the difference between my calculations and the usual ones?  The following changes:

  • For rebound rates, the number of available rebounds for a player is usually estimated based on the team’s rebounding rates and the player’s minutes.  With my method, the actual number of rebound opportunities is determined.
  • For assist rate, the number of field goals made by teammates when a player is on the court is normally estimated based on the player’s minutes and the team’s total field goals.  With my method, the actual number of teammate field goals is determined.
  • For block percentage, the number of opposing field goal attempts when a player is on the court is estimated.  I use the play-by-play data to get an actual count.
  • For steal percentage and usage rate, player and team possessions are normally estimated, but we can use the play-by-play to count the actual number of possessions.

The numbers for every player are available in the Google Docs spreadsheet below:

http://spreadsheets.google.com/ccc?key=0AvNKNGJ_AHijdEgwV3FrQ25rVTZVbVR4ZEtYcHp5bkE&hl=en

My next step is to calculate PER using these numbers, and I plan to get to that shortly.  Much credit again must go to Ryan Parker for inspiring me to do this.

»  Substance: WordPress   »  Style: Ahren Ahimsa
© Copyright 2009 Basketball-Statistics.com