The following is part of a weekly series at the Orlando Magic blog, Third Quarter Collapse.
Some of the best stats out there, ones that most fans familiar with advanced stats know about, are actually based on estimates using box score data. For example, when we calculate Marcin Gortat’s Offensive Rebound Rate, we’re trying to determine what percentage of available offensive rebounds he collected while he was on the court. However, we don’t really know how many rebounds were available. We have to estimate based on how things usually go for the Magic and their opponents, and assign a portion of that to Gortat.
Using box score data, that’s the best we can do. But we also have play-by-play data, and we don’t have to estimate. We (actually, a programming script) can go through the hundreds of thousands of recorded plays from the NBA 08-09 season, and find how many of those resulted in offensive rebound opportunities for Gortat. From there we just total how many offensive boards he had, and divide that by the number of available ones.
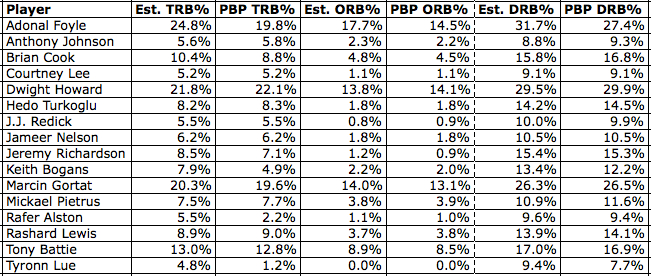
This method removes some of the guessing game, and the results of this method on various stats for the Magic will be discussed today. For a full explanation of how everything works, I will refer you to the article I wrote over at Basketball-Statistics.com last Thursday, which is here. Let’s start by comparing the estimated rebound rates to the actual ones, as calculated from the play-by-play data:

We can see that the estimates are pretty darn close. Amazingly, though, Dwight Howard is an even better rebounder than we thought (by 0.3%). Gortat’s offensive rebounding may have been slightly overestimated, but his defensive rebounding was underestimated. The biggest differences were for Keith Bogans and Rafer Alston, who were actually not rebounding as well as we thought.
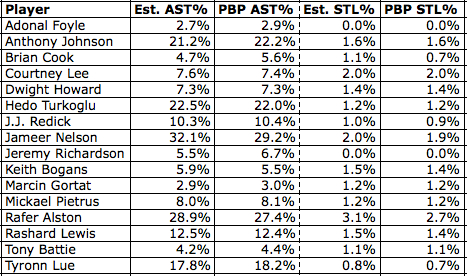
Now let’s move on to some stuff for the little guys. Here are the comparisons for assists and steals:

Jameer Nelson’s Assist Rate may have been inflated, while Anthony Johnson didn’t receive enough credit. When we use the play-by-play data instead of the estimates, the difference between the two shrinks from 10.9% to 7%. My play-by-play steal rates are slightly lower for every player, and that may have something to do with differences in the way I calculated possessions.
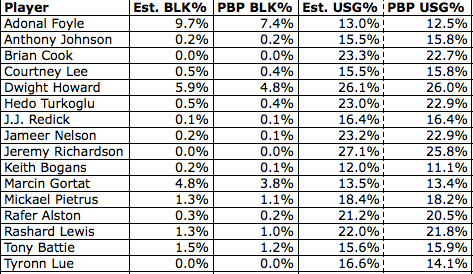
Finally, let’s look at blocks and usage rate:

Again, we see that each player’s PBP data is less than his estimated data. This is not a Magic-only thing. The reason for this difference is again due to different calculations. Block percentage is normally calculated as the percentage of opponents’ two-point attempts that were blocked by the player in question. My calculations counted three-point attempts as well. I feel that this way is more appropriate because, even though it’s rare, three-pointers do get blocked. With usage rates, we again see that the estimates were actually pretty close to the real thing.
Because the differences between the estimates and the play-by-play data are usually small, this information may seem trivial. In many ways, it is. However, it’s nice to get that warm fuzzy feeling when you know the numbers you’re looking at are thoroughly calculated instead of just estimations.
What, does nobody else get that feeling?